- Share
- Share on Facebook
- Share on LinkedIn
Osteoarthritis (OA), the most widespread joint disease,-more than 40 million people are affected across Europe2-, is a growing public health concern as it represents the most common cause for disability with consecutive annual health care costs of up to $128 billion in the USA3,4.
Phase contrast imaging: an anatomic imaging modality for joint diseases
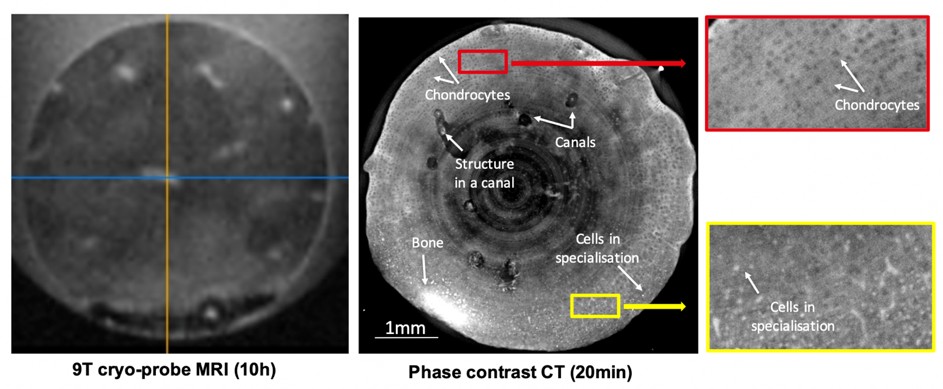
At high spatial resolution (1-10µm) PCI-CT is an invaluable tool for analyzing the internal cartilage matrix. The level of information achieved by PCI-CT can be helpful for studying disease mechanisms as well as evaluating therapeutic regenerative medicine approaches. Figure 1 shows preliminary results on high-resolution imaging of a bovine cartilage explant. In this study5, an in vitro model of cartilage maturation was used to highlight the capabilities of PCI-CT. This figure compares the level of details achieved with a state-of-the-art MRI (9T with a cryoprobe) and PCI-CT. In the PCI-CT image the chondrocytes are clearly visible (black round structures in the cartilage matrix) as well as the cells in specialization (indicated by arrows) i.e. the cartilage to bone transformation. These structures are not visible in MRI even when the acquisition time is increased by more than one order of magnitude. Cartilage canals6 are visible for the first time in 3D both in MRI and PCI-CT but it is only in the PCI-CT images that we manage to render the remaining blood vessels within those canals. In this study, we demonstrated a clear difference between both the density and the spatial distribution of chondrocytes. PCI-CT is, therefore, a unique and novel imaging approach to study the quality of the cartilage inner matrix and I propose to develop new histo-morphometric measures of the cartilage quality. Such an approach has been employed using conventional micro-CT7,8 but the use of chemical staining limits its use to only a one-time visualization. It is indeed impossible with such an approach to follow-up the quality of the cartilage matrix and subchondral bone while PCI-CT with a reduced deposited dose is a completely non-invasive modality that can be repeated at several time points, allowing for follow-up.
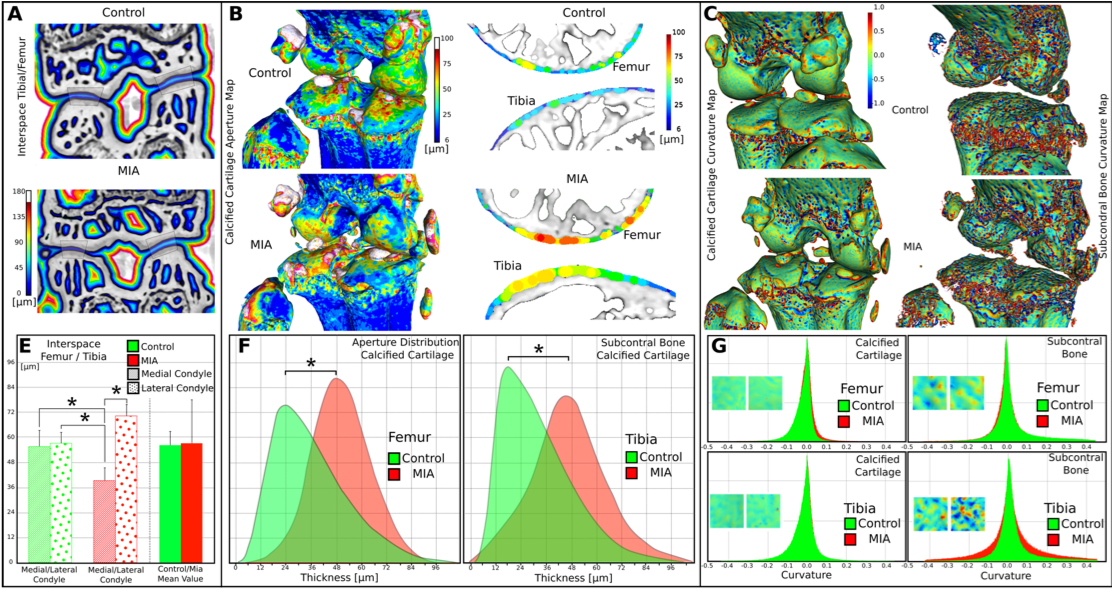
These images demonstrate that all the tissue types are clearly visible in this mouse knee. To the best of our knowledge, it is the first time that the calcified cartilage can be segmented and its thickness as well as the articular cartilage surface roughness measured. With these results, we demonstrate that some tissue markers may be discriminant between control and OA animals and may constitute valuable and new 3D histo-morphometric parameters of OA. But such a study has to be carried out on a larger number of animals and in vivo for a better understanding of the mechanisms of the disease.
References
- Bitton, R. The economic burden of osteoarthritis. Am. J. Manag. Care 15, S230-5 (2009).
- WHO Scientific Group on the Burden of Musculoskeletal Conditions at the Start of the New Millennium. The burden of musculoskeletal conditions at the start of the new millennium. World Health Organ. Tech. Rep. Ser. 919, i–x, 1–218, back cover (2003).
- Hootman, J. M. & Helmick, C. G. Projections of US prevalence of arthritis and associated activity limitations. Arthritis Rheum. 54, 226–9 (2006).
- Centers for Disease Control and Prevention (CDC). National and state medical expenditures and lost earnings attributable to arthritis and other rheumatic conditions--United States, 2003. MMWR. Morb. Mortal. Wkly. Rep. 56, 4–7 (2007).
- Labriet, H. et al. High Resolution X-Ray Phase Contrast Imaging of Maturating Cartilage. Microsc. Microanal. 24, 382–383 (2018).
- Lutfi, A. M. Mode of growth, fate and functions of cartilage canals. J. Anat. 106, 135–45 (1970).
- Tremoleda, J. L. et al. Imaging technologies for preclinical models of bone and joint disorders. EJNMMI Res. 1, 11 (2011).
- Hayashi, D., Roemer, F. W. & Guermazi, A. Imaging of osteoarthritis—recent research developments and future perspective. Br. J. Radiol. 20170349 (2018). doi:10.1259/bjr.20170349
- Share
- Share on Facebook
- Share on LinkedIn